Flood Map Changes in Maryland
Maryland counties have redrawn their floodplain maps after FEMA completed its coastal flood hazard and mapping studies along the coastlines of Delaware, Maryland, Pennsylvania and Virginia.
The maps below show floodplain map changes in Annapolis, Baltimore and Ocean City.
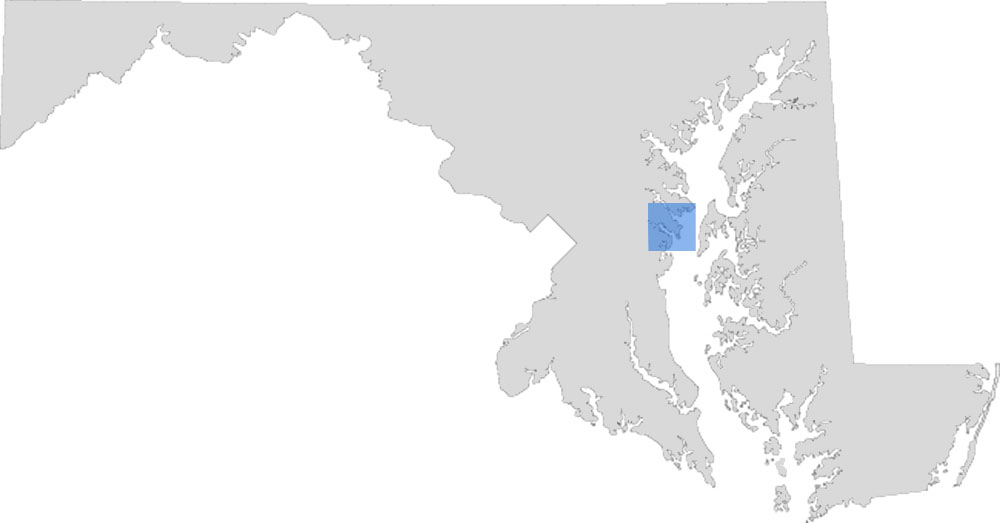
ANNAPOLIS
Anne Arundel County's flood map changes go into effect Feb. 18, 2015.
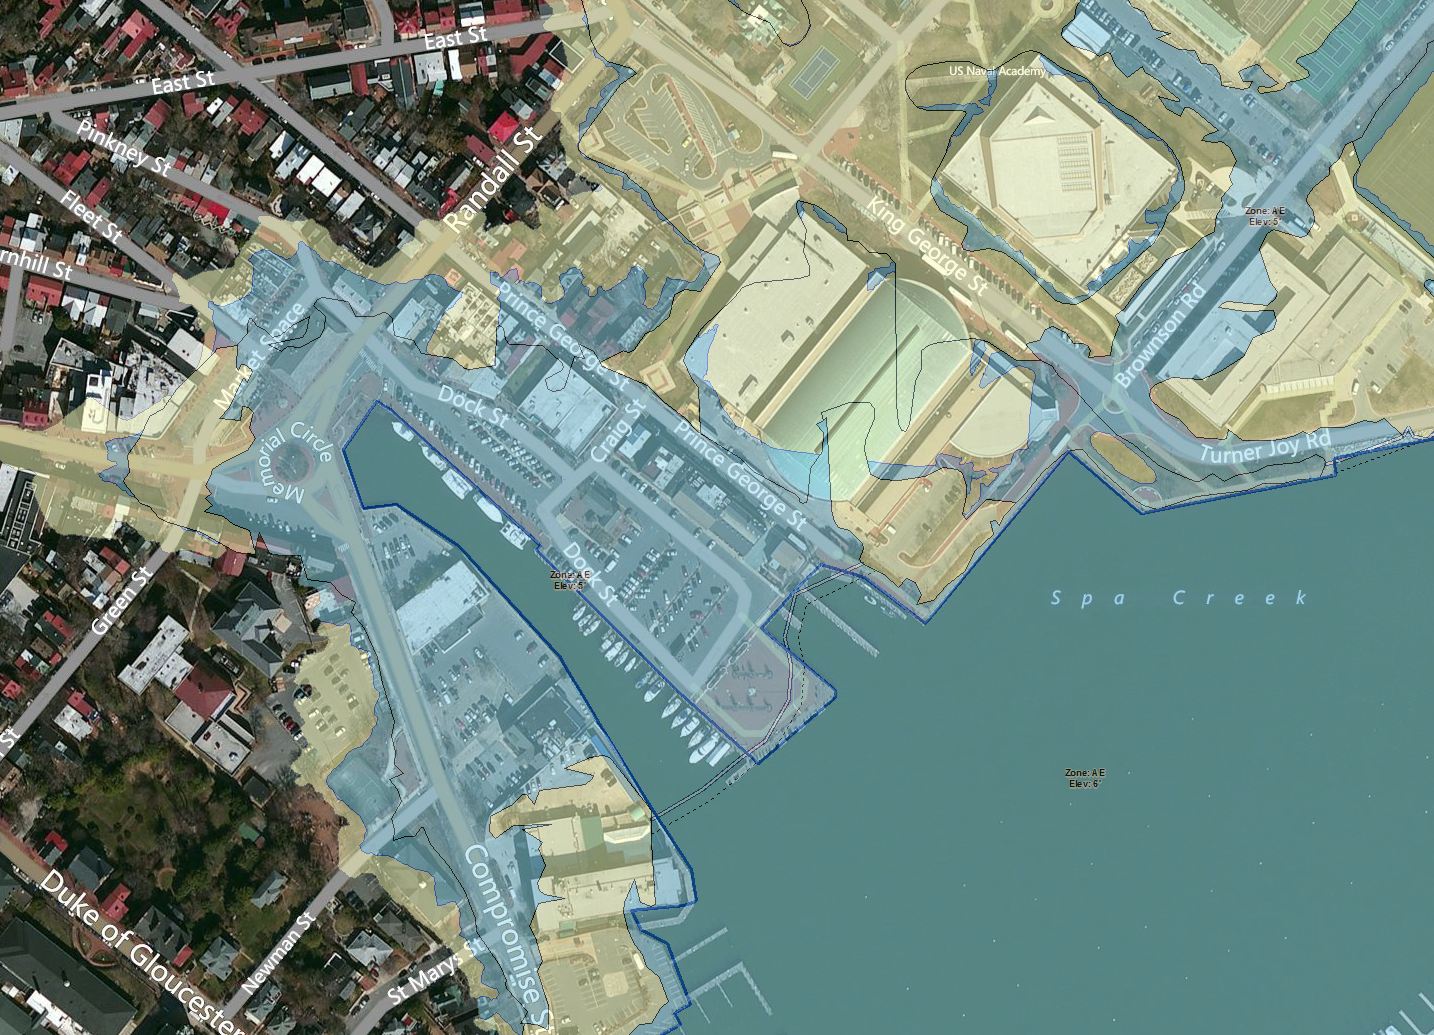
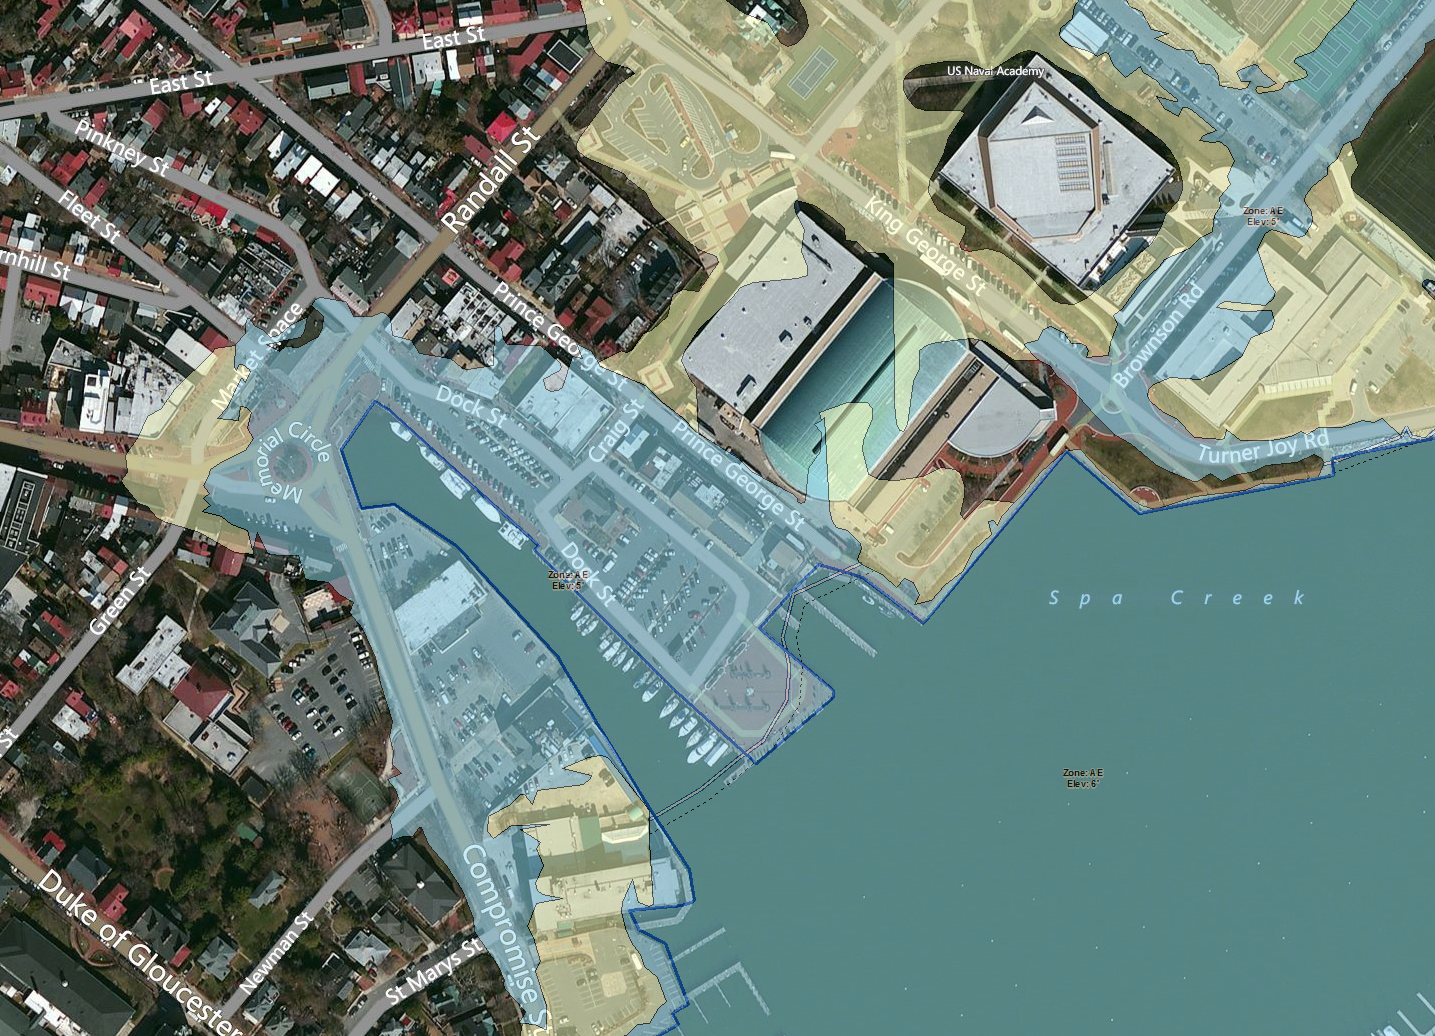

(lowest risk)
0.2 percent
(moderate risk)
1 percent
Properties are moving out of the low and moderate flood risk zones. A row of businesses on Market Street (just above the Market Space) is moving out of the flood zones.
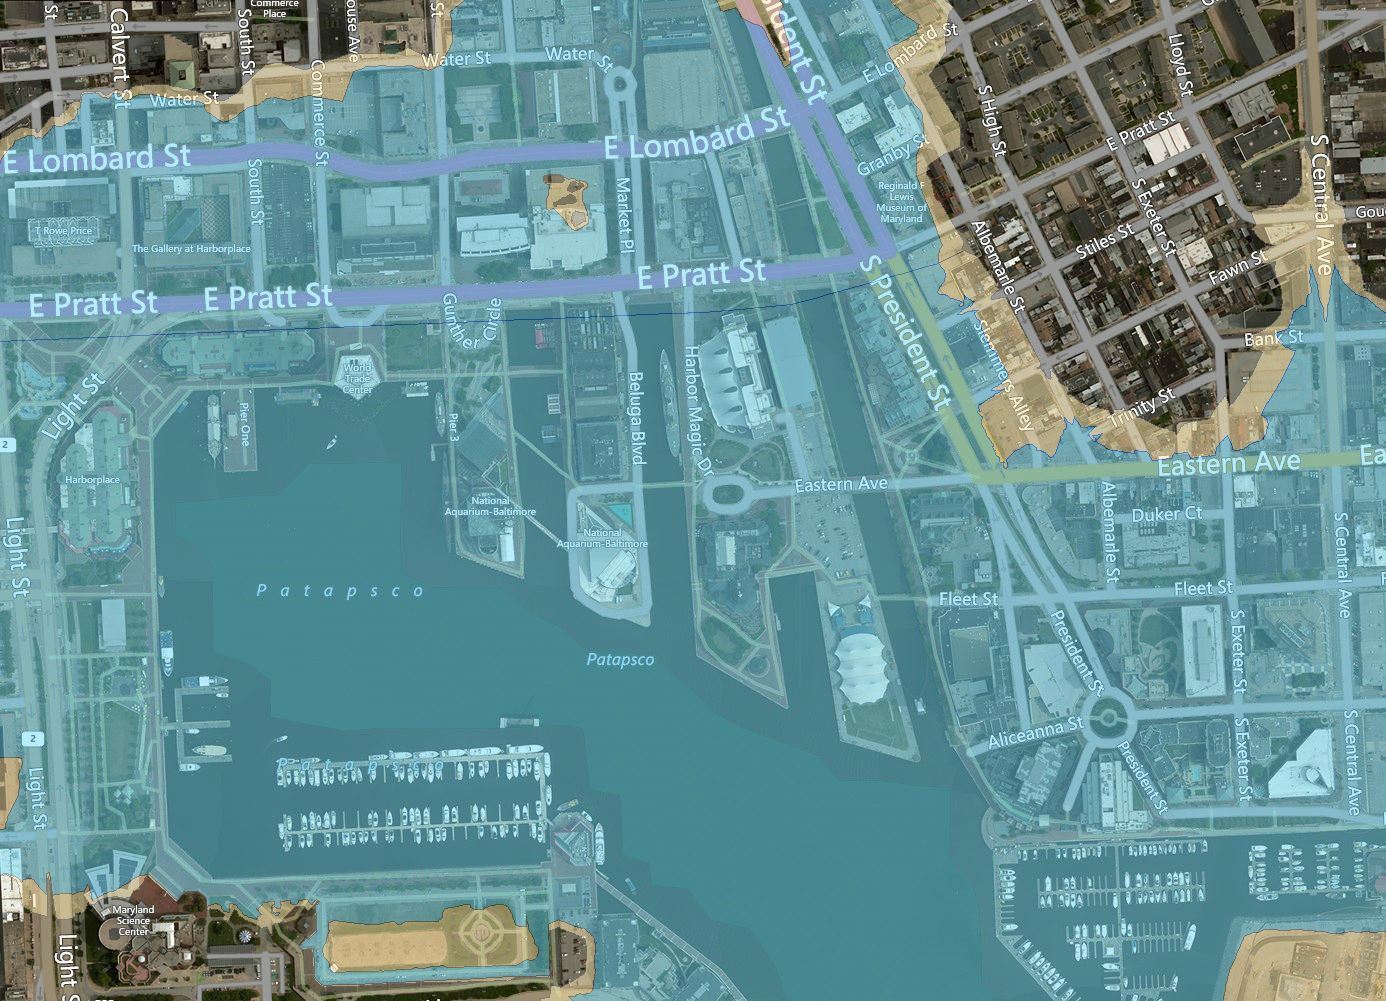
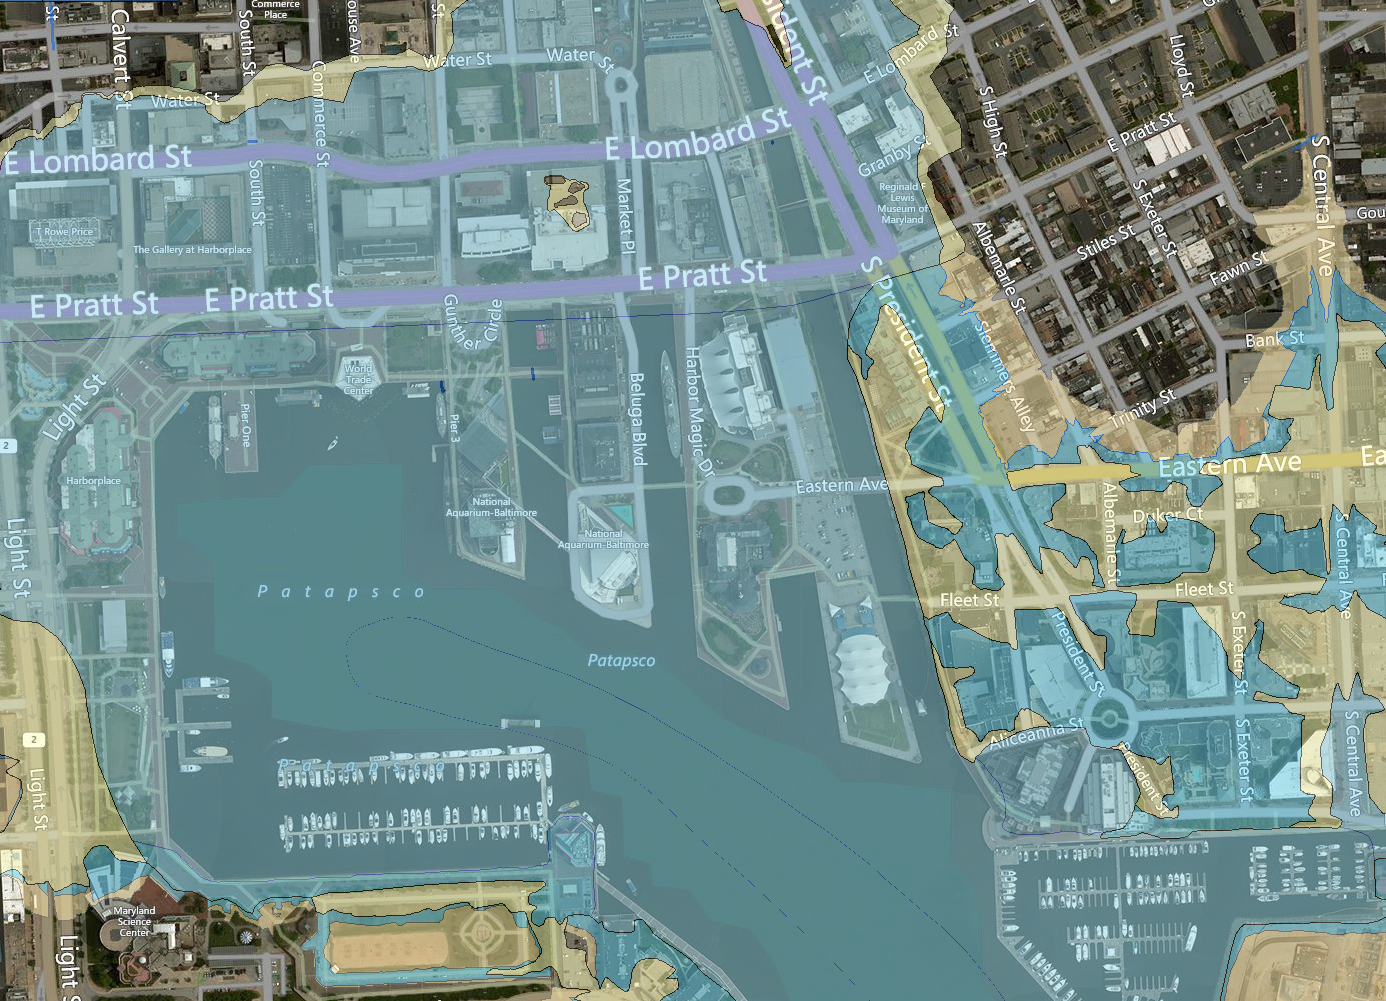
BALTIMORE
Baltimore City's flood map changes went into effect April 2, 2014.
(lowest risk)
0.2 percent
(moderate risk)
1 percent

(moderate risk)
1 percent with waves up to 3 feet
In Baltimore, properties surrounding the Inner Harbor moved out of the dark blue region of the flood map in 2012. This means they are no longer in a zone that is susceptible to wave action.
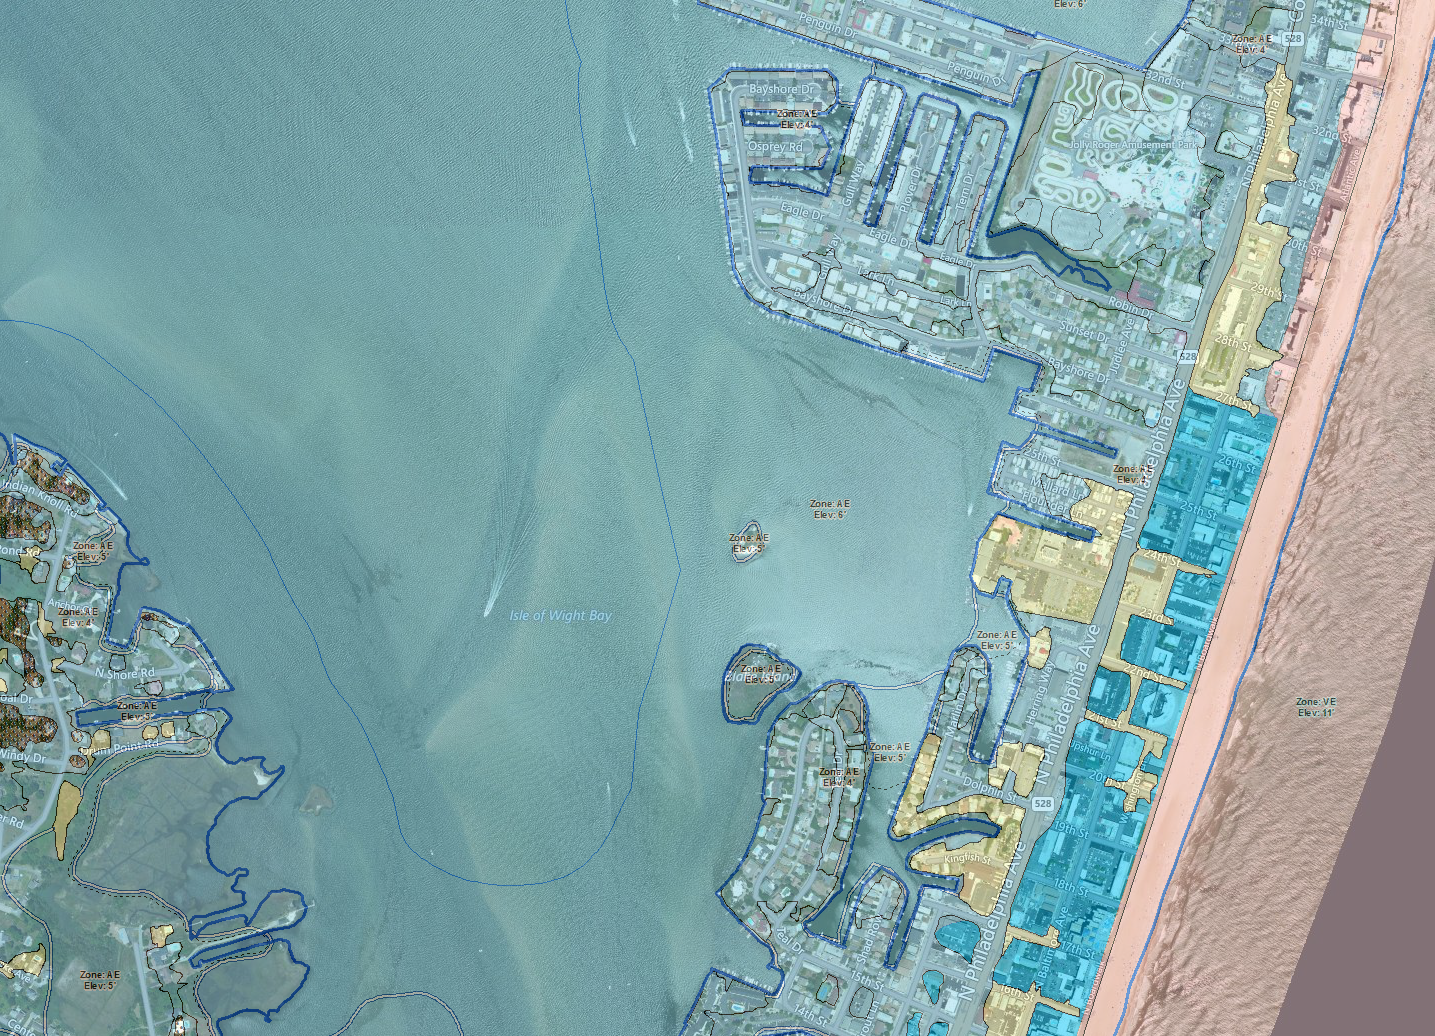
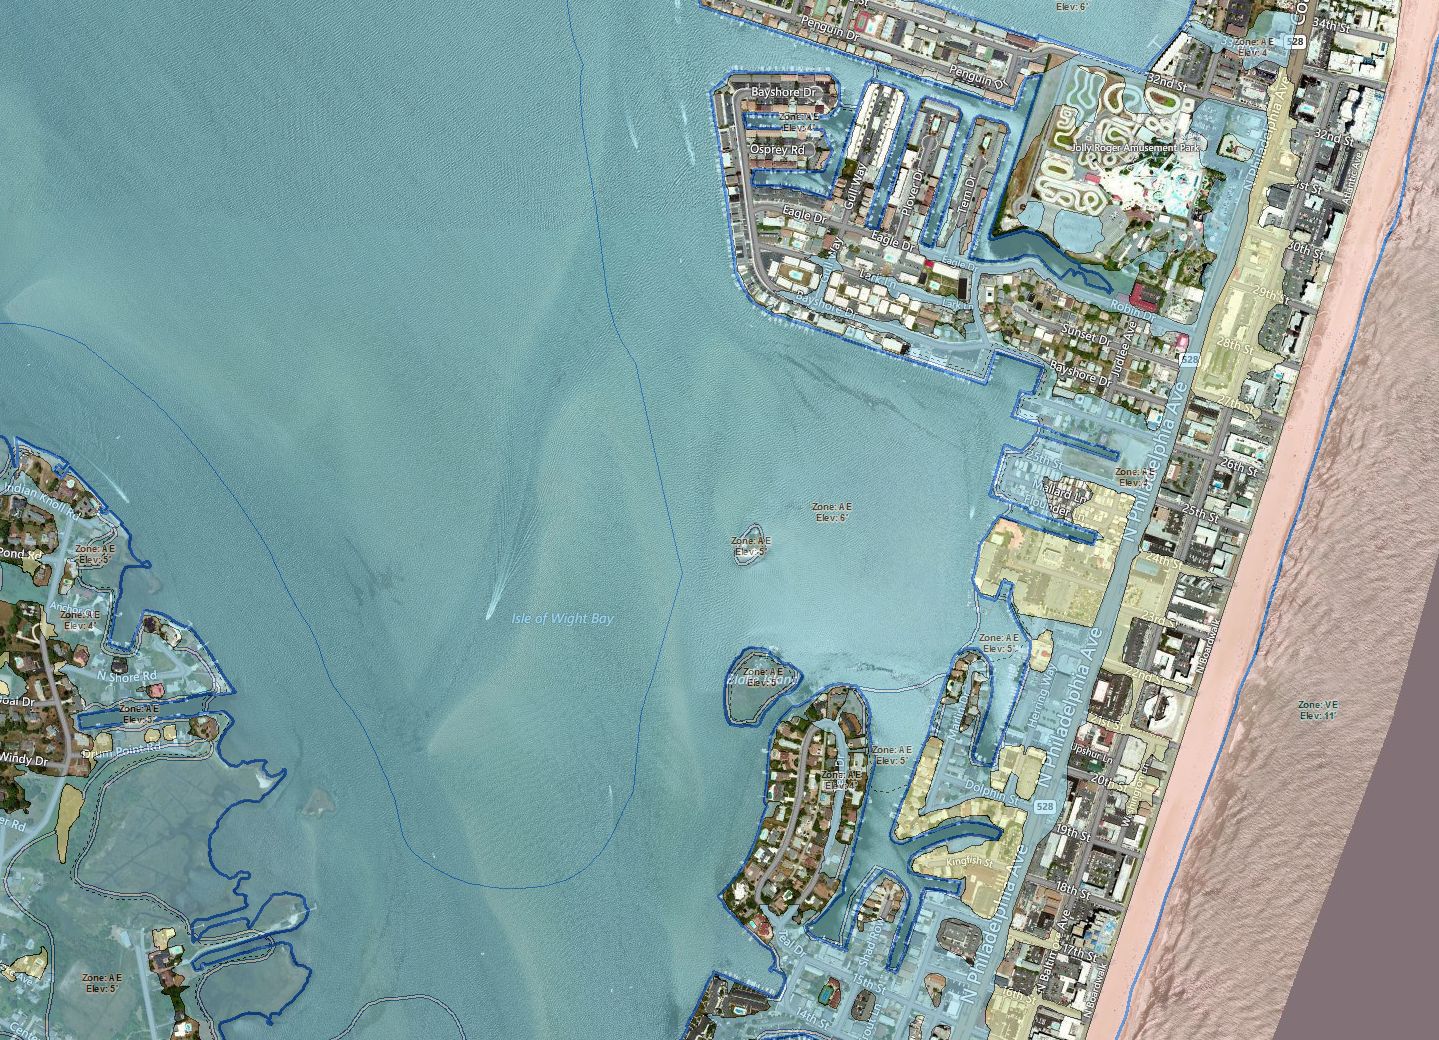
OCEAN CITY
Worcester County's flood map changes will go into effect May 18, 2015.
(lowest risk)
0.2 percent
(moderate risk)
1 percent
(moderate risk)
1 percent with waves up to 3 feet

(high risk)
1 percent with waves over 3 feet
Some properties along the ocean are moving out of the flood zone that is susceptible to wave action. On the bay side, many properties are moving entirely out of the flood zone.