Extreme temperatures pose a serious, long-term health threat for people with chronic medical conditions like asthma, respiratory diseases, obesity, diabetes, heart disease, cancer, mental illness and multiple sclerosis. We all know that people die of heat stroke in the summer or of heart attacks after shoveling snow. We know a lot less about the long-term effects on large populations of living in extreme heat and cold. Reporters at the Philip Merrill College of Journalism at the University of Maryland are working with National Public Radio and students at Wide Angle Youth Media in Baltimore on a project to look at how heat and cold in Baltimore homes affect residents' health – particularly as climate change becomes more and more significant. Learn more and get involved.
We’re analyzing data to explain connections between temperature, health and neighborhoods in Baltimore

By Jake Gluck
Capital News ServiceMarch 06, 2019
Our team has spent the last year learning how extreme heat and extreme cold driven by climate change influence the health of people who live in Baltimore.
A big part of our effort: exploring whether health, income and other factors may put people in some neighborhoods that are disproportionately affected by the “urban heat island” phenomenon at greater risk than people in other neighborhoods.
To do this, Capital News Service’s data journalism team is analyzing an array of data, including: block-by-block temperature data, detailed records of hospital visits that show the prevalence of specific medical conditions exacerbated by temperature, emergency response (EMS) data, satellite images showing tree cover variation by neighborhood in the city, utility shut off data, housing inspection data, data from temperature sensors inside of residents’ homes and more.
Here are just a few of the questions we’re attempting to answer with data analysis:
- Is it hotter in the summer and colder in the winter in some Baltimore neighborhoods?
- In those neighborhoods, is there a higher rate of chronic medical conditions that could be affected by extreme temperatures -- things like asthma, diabetes or heart disease?
- Do people in those neighborhoods have lower incomes and are they more likely to rent than own their houses, two factors that could influence their ability to properly weatherize their homes?
Here’s a small taste of what we’ve found so far:
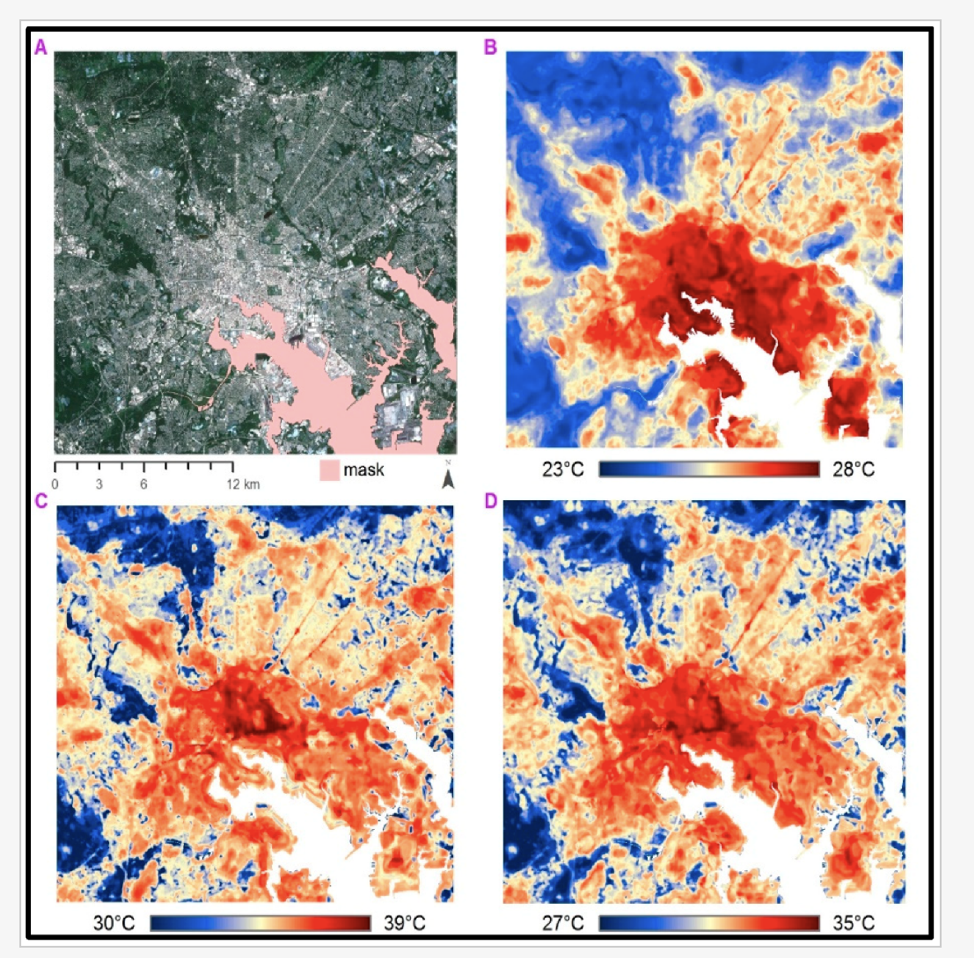
- In the peak of summer, there’s a lot of variation in temperature between neighborhoods. Last summer, a team of researchers from Portland State University and the Science Museum of Virginia took thousands of temperature measurements from all across Baltimore on an especially hot day, and used machine learning to create an incredibly detailed, block-by-block measurement of the entire city. Using their data, we were able to calculate that the median temperature of the warmest ZIP code, 21202 in downtown Baltimore, was 91 degrees fahrenheit and the lowest, 21208 a leafy neighborhood in northwest Baltimore, was 86 degrees fahrenheit.
- By mashing up that ZIP code median temperature data with U.S. Census data, we were able to examine the relationship between temperature and neighborhood features. So far, we’ve found that hotter neighborhoods typically have a higher percentage of renters, a higher percentage of vacant houses and a lower percentage of single family homes than colder neighborhoods. We have also found that hotter neighborhoods typically have a younger population, a higher poverty rate and a lower median household income than cooler neighborhoods. We are not saying heat caused these factors, or vice versa, just that they are strongly related.
- We also have access to very detailed records of hospital visits in Maryland, which we can use to calculate the prevalence of very specific health conditions for each ZIP code in Baltimore, like asthma, a condition affected by heat. And we’ve found that, for asthma, there is a strong relationship between a neighborhood’s temperature and the asthma prevalence rate. The hotter the neighborhood, the more likely it is to have a high asthma rate. Again, we are not saying heat caused the higher asthma rate, just that they are related.


