BALTIMORE - Boarded-up homes, crumbling store fronts and police cameras with blue lights line the streets of Park Heights. It’s in one of Baltimore’s poorest ZIP codes, where the median household income is about $35,000.
Yet people spent $34 million on lottery tickets here in calendar year 2012 -- more than any other ZIP code in the state, a Capital News Service analysis found.
Evert Chapman, a truck driver from Park Heights, said he’s not surprised.
“We play to make some extra money,” said Chapman, 34, as he jotted down numbers on the back of a Keno ticket inside Hoffman’s Liquors on Park Heights Avenue. “I want some extra money. We all do.”
The Maryland Lottery has become the fourth largest source of revenue for the state, contributing $545 million last fiscal year, according to the lottery agency’s comprehensive financial report.
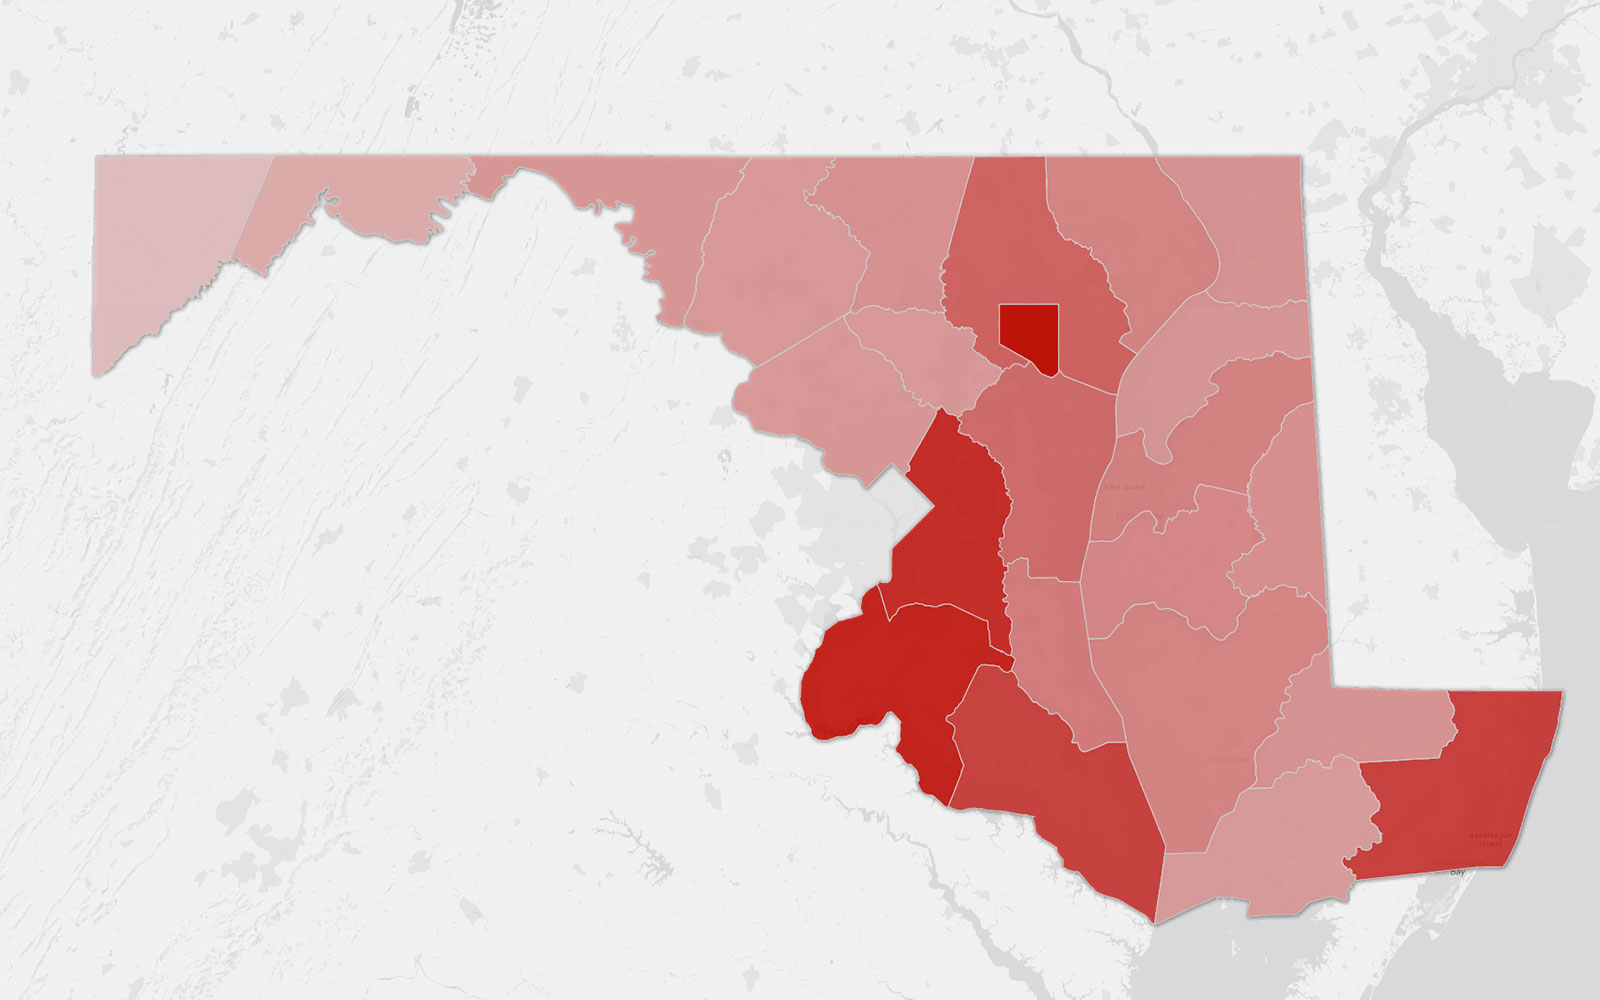
But a Capital News Service analysis found that lower-income ZIP codes contributed a disproportionate share. The analysis also found more than a third of the revenue came from Prince George’s County and Baltimore City. Baltimore City led the state in average dollars spent on lottery tickets per adult, followed by Charles County and Prince George’s County.
Lottery officials said they do not know the reasons for the disproportionate spending from those communities.
“It’s not something we analyze or look at,” Jackie Vincent, the director of gaming research and chief of staff at the gaming agency, said.
Agency officials say that their job is to raise revenue for the state, but they don’t set policy. “That’s sort of where we struggle, too. We’re a state agency and a business,” Vincent said.
When told about the CNS findings, Gov. Martin O’Malley and Maryland Senate President Thomas V. “Mike” Miller declined to comment through their spokespersons. House Speaker Michael E. Busch did not respond to interview requests.
However, the findings are not a secret to Maryland officials: A 2011 state-funded study found that low-income residents, African-Americans and people with lower levels of education are more likely to gamble weekly on lottery games and in casinos than other Marylanders.
The study was commissioned by the Department of Health and Mental Hygiene and was required under the law that allowed casinos to open in Maryland.
The state legalized casino gambling in 2008. Four casinos have opened, generating $608.7 million in state revenue in fiscal 2013, with two more scheduled to open in Baltimore and Prince George’s County. Combined with lottery sales, gambling now contributes more than $1 billion annually to the state.
Vincent said that an agency program -- though not directed specifically at low-income residents -- allows problem gamblers to sign up for a two-year or lifetime ban on playing the lottery. They are blocked from cashing winning tickets when they enter their Social Security numbers to collect.
As of March, she said, 41 people had signed up.
State Sen. Lisa Gladden, D-Baltimore, who represents Park Heights, said that she is a lottery player and, while she might like people to spend their money differently, it’s not up to the legislature to decide for them.
She added the state wouldn’t need the lottery if lawmakers would raise taxes enough to pay for state services.
“It’s a poor trade and we shouldn’t do it that way, but we do,” she said.
The state sends about $20 million a year from lottery revenue back to Baltimore to pay off bonds on the Orioles’ $205 million ballpark and the Ravens’ $229 million football stadium, both built in the 1990s. Beginning this year, $20 million a year in lottery money also will help pay for a Baltimore public school construction program.
The legislature ought to consider creating a local impact fund that gives neighborhoods like Park Heights a share of the money, similar to the local impact grants that come from casino revenues, said Will Hanna II, CEO of the New Park Heights Community Development Corporation, who unsuccessfully challenged Gladden for her Senate seat in June's primary.
Gladden also said that lottery money should benefit the communities that contribute the most revenue.
“If we have to pay for it, we ought to get something back,” she said.
“Pleasant way” to pay taxes
The state entered the lottery business in 1973, after voters approved a constitutional amendment. In the debate over gambling that preceded the vote, Del. Joseph W. Sachs, an Anne Arundel County Democrat, called it a “pleasant way for people to pay taxes.”
But Sen. Margaret C. Schweinhaut, a Montgomery County Democrat, warned that “it’s the poor person who will be supporting the lottery.”
Four decades after her prediction, CNS examined lottery sales data to see if she was right.
The news service filed a public records request to obtain sales data for calendar year 2012, the most recent full year available at the time.
Players spent $1.69 billion on lottery tickets in 2012, the data show. The state paid about $943 million of that in claims.
CNS broke down the gross sales revenue by county and by ZIP code. Using census data, the ZIP codes were ranked by median household income and then evenly divided by population into five income groups, or quintiles. Each quintile represented 20 percent of the population.
A clear trend emerged: The lower the income group, the higher the lottery sales.
The largest share came from ZIP codes in the lowest fifth, such as 21215 which includes Park Heights. They represented 20 percent of the population but contributed 27 percent of the total lottery ticket sales revenue.
The second fifth -- ZIP codes still below the state’s median household income of $70,000 -- accounted for 25 percent of sales.
ZIP codes in the third and fourth quintiles generated 19 and 17 percent, respectively. The smallest share of sales, 12 percent, came from the top fifth of ZIP codes, with median household incomes of over $100,000.
The analysis reflects where tickets are sold, because information on where players live is not available.
The 2011 state-funded study surveyed nearly 6,000 residents on their gambling habits. The study found that the very poor gamble more frequently than others. Those with incomes less than $15,000 are nearly 50 percent more likely to gamble on a weekly basis than those with incomes greater than $35,000, on average.
A study of fiscal year 2005 Maryland lottery sales data by researchers at the University of Maryland Baltimore County also found a disproportionate share came from socio-economically disadvantaged groups.
“Our results show that the voluntary tax collected by the Maryland lottery comes disproportionately from census tracts populated by African Americans and low-income residents,” the study said.
Researchers cited previous studies that showed evidence that lotteries are regressive and suggested that “for the current public policy debate to be fully informed it is important to have information about who pays the ‘voluntary tax’.” The researchers urged state officials to consider whether the lottery was “consistent with their broader social policies.”
Per-capita spending was highest in Baltimore in calendar 2012, an average of $579 a year for every adult 18 and older, while the state average is $382 -- although that may be due in part to commuters and tourists who play while in the city.
Prince George’s County was third highest with an average of $529 per adult, just behind its neighbor to the south, Charles County, which averaged $547 per adult per year.
The smallest per capita spending came from counties in Western Maryland, where there is competition from county-regulated games of chance -- such as tip jars, commonly found in bars and fraternal halls, in which players pay a dollar for a chance to draw a winning number from a container.
Prince George’s County contributed the most overall, $348 million, followed by the City of Baltimore with $281 million.
10 games to choose from
Chapman, the truck driver from Park Heights, said he has been playing the lottery for more than 13 years and plays every day -- in the morning before work and in the afternoon after his shift ends.
“That’s the only way you can win: Got to play hard,” he said.
His biggest win came a few years ago when he hit $15,000 playing Pick 4, he said.
“I invested it,” he said. “Put it in my savings like a retirement fund. It helped to pay the bills, too.”
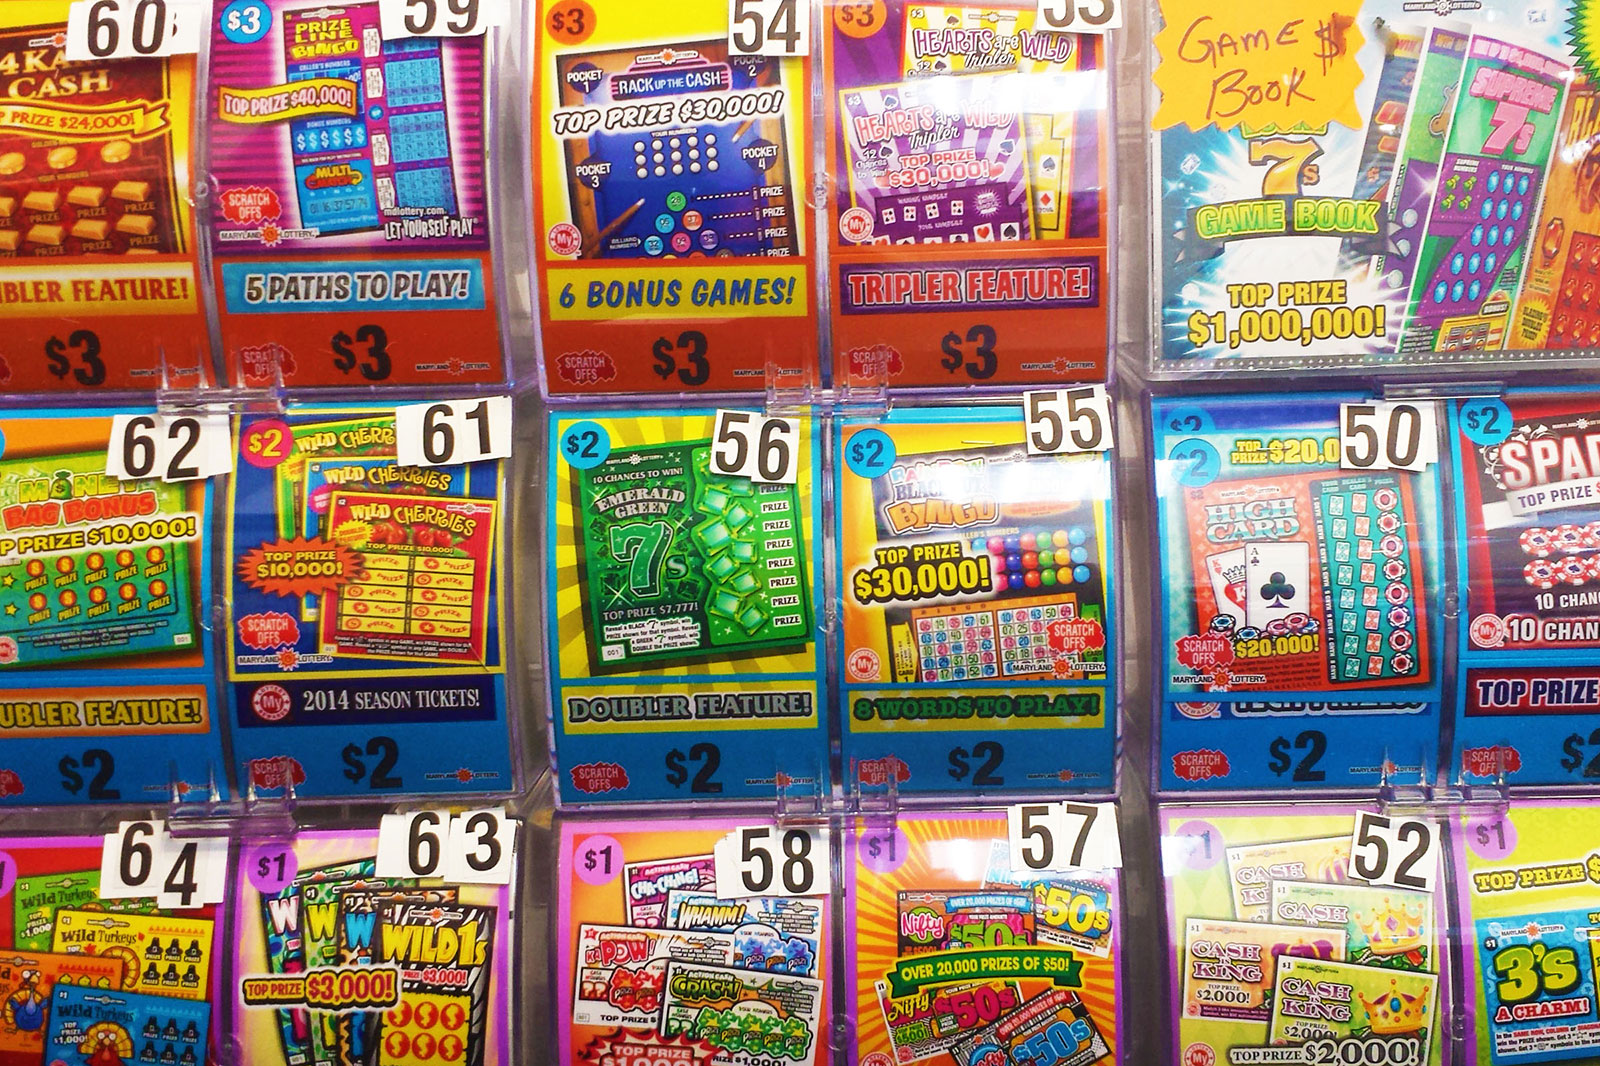
Players can choose from 10 different games in Maryland, ranging from traditional lotteries like Pick 3 and Pick 4 to multistate drawings like Powerball, from instant scratch-offs to video terminal games like Keno and Racetrax, an animated horse race.
The most popular games are scratch-offs, Keno, Pick 4 and Pick 3, in that order. Scratch-offs provide instant prizes. With Pick 3 and Pick 4, players choose numbers for twice-daily drawings. With Keno, players pick up to 10 numbers for drawings that are broadcast every four minutes to computer monitors in stores around the state.
The odds of coming out ahead in the long-term are low. Players can expect to win back about 60 cents for every dollar spent on Keno, and about 50 cents for Pick 3 and Pick 4.
The CNS analysis could not calculate the expected return for scratch-offs, the top most played lottery game in the state, due to the complexity of the game. Maryland’s lottery currently offers 84 different scratch off games, ranging in price from $1 to $20 with the most expensive games carrying top prizes of $1 million.
“I can tell anybody that the odds are against you,” said Carl Nickens, a retired government worker in Temple Hills. “That’s why they call it gambling and luck.”
He was playing at Marlow Winghouse, a local restaurant that was recently renovated to feature televisions displaying electronic lottery games, a large seating area and fluorescent light covers with the Maryland Lottery logo.
With more than $5.66 million in lottery sales last calendar year, Marlow Winghouse was the top lottery retailer in Prince George’s County and number two in the state. (Sodapop Shop, a convenience store just outside of Baltimore City, was number one with just over $5.72 million in sales.)
“I originally started for fun, but then I hit it big years ago, and then I got hooked on it,” said Nickens, who described himself as a retired government worker and regular player.
“I think everybody’s hooked. I hit $20,000 years ago from Pick 4, but they’ve got that back by now,” he said as he sat near the serving area playing Bonus Match 5.
The zip code that includes Temple Hills has a median household income of about $64,000, placing it in the second lowest income group in the CNS analysis.
Market demand and saturation are the main considerations when the agency approves applications from retailers, Vincent said. The agency also doesn’t target particular areas in its advertising.
“Our marketing dollars get spread evenly across the state,” Vincent said. She added the agency’s marketing is focused on trying to get new players in the 18-to-35 age range.
Lottery retailers follow the money, said Donald F. Norris, director of the Maryland Institute for Policy Analysis and Research, who co-authored the 2010 and 2011 studies.
“Lottery retailers know where to go,” he said. “They don’t locate in places where people are less likely to play the lottery. So there’s a much higher incidence of lottery where there are high proportions of poor people and African-Americans.”
Hyon-Young Kim and Amirah Al Idrus contributed to this article.