Where there was data, our CNS Data Lab team was there to find the story and visualize it. From the inauguration to early cherry blossom blooms, we’ve rounded up the top data visualization stories from 2017.
We hit the ground running in January – new president, new data, new stories.
Obama’s inaugural musicians significantly outsell Trump’s
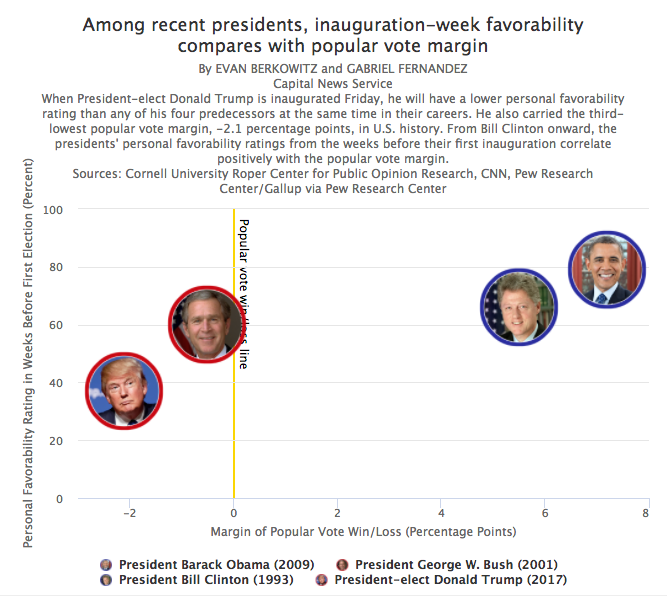
Trump to take office with historically low approval ratings
February was jam-packed with Super Bowl antics and fun NBA stats.
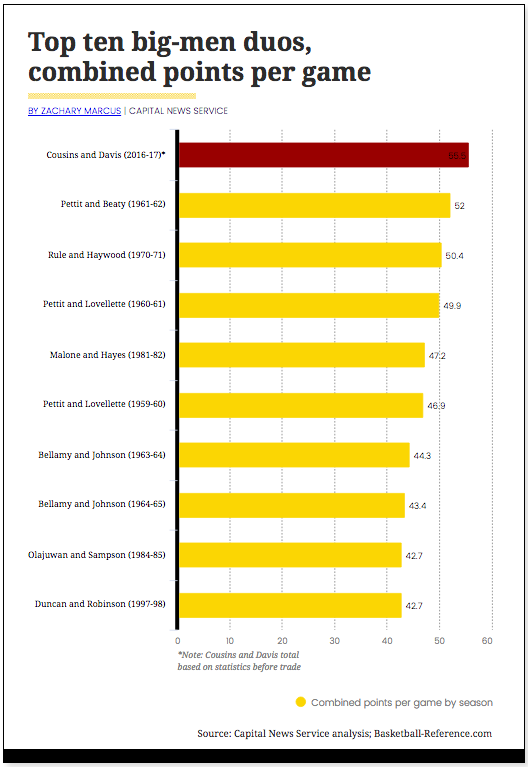
Cousins, Davis poised to be best big man duo in NBA history
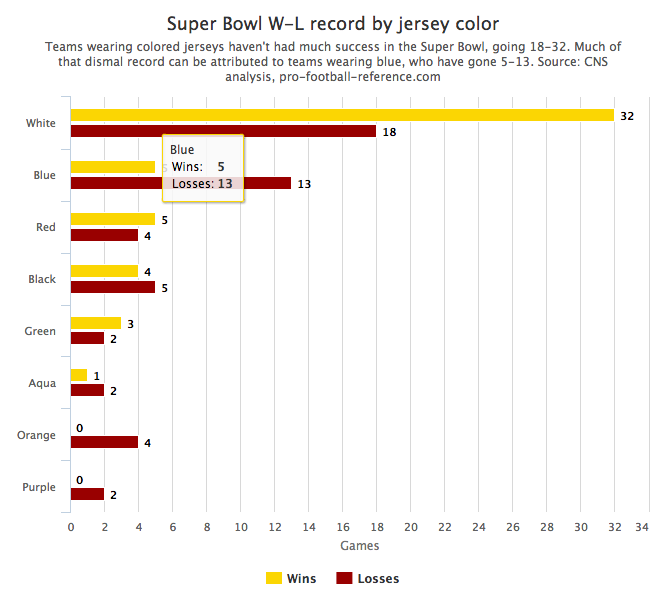
Teams in white jerseys win Super Bowl with improbable regularity
Busted brackets and record-breaking peak blooms? Sounds like March to us.
Perfect brackets almost never survive past day one of the NCAA tournament
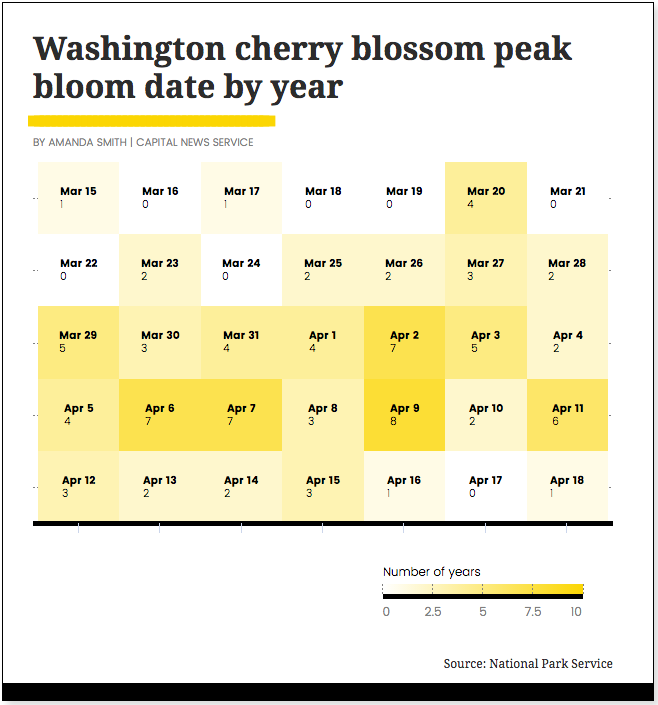
Cherry blossom peak bloom could be one of earliest in history
And of course, we ended our year strong in April with breakdowns of shutdowns and show downs (on the court, that is).
A Breakdown of Government Shutdowns
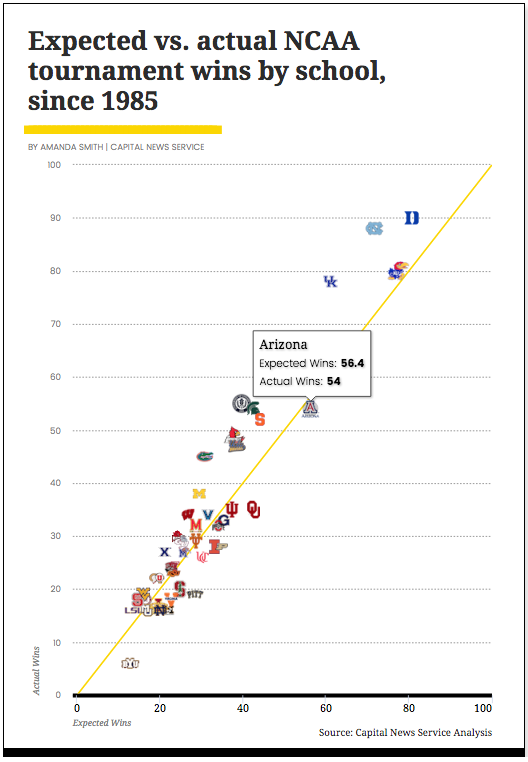
North Carolina outperforms their seed more than almost all other teams




You must be logged in to post a comment.